Colors in the City
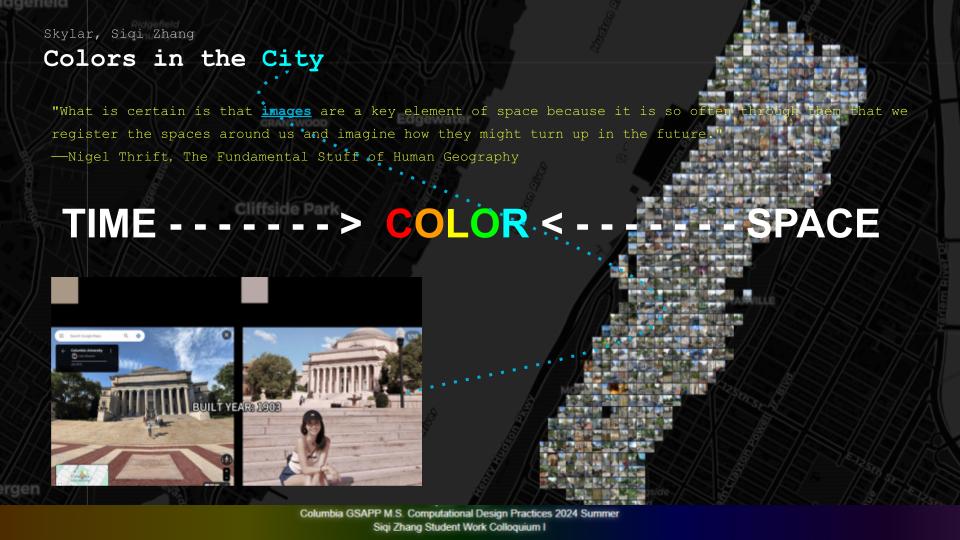
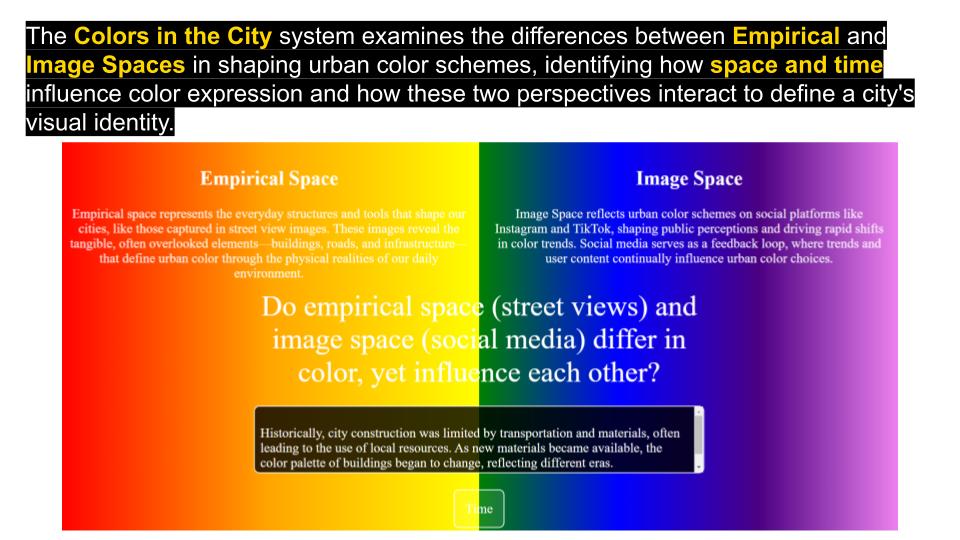
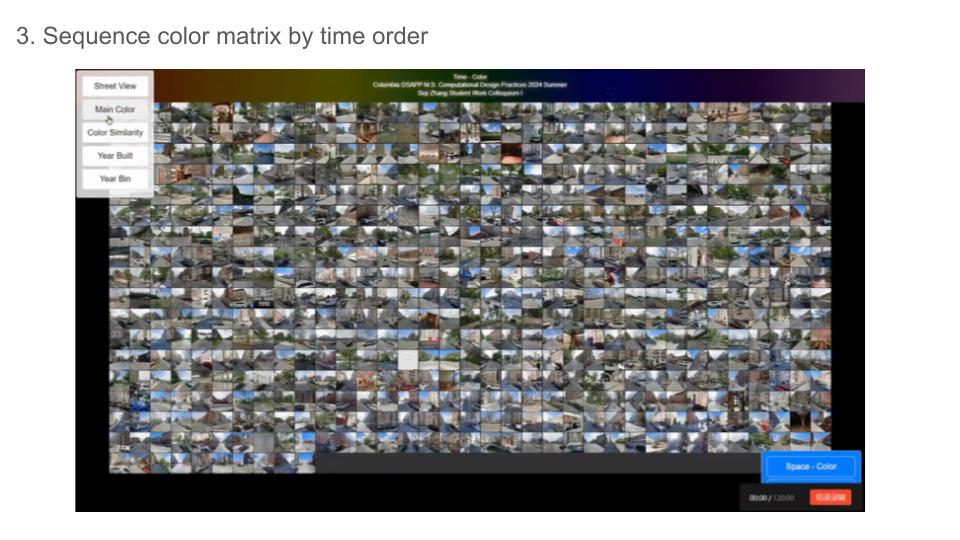
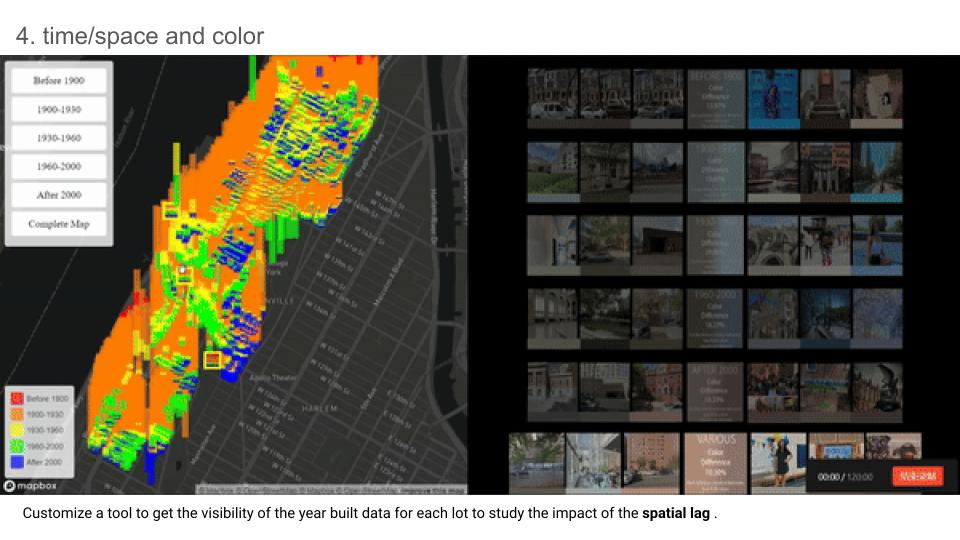
Colors in the City is an interactive system that contrasts Empirical Space—street‐view facades—with Image Space—social‐media snapshots—to uncover how time and place shape urban color schemes. By mapping dominant facade hues against building age and geographic context across Manhattan, it reveals patterns of material history and cultural framing, and shows how digital trends and physical structures continually influence each other’s palette.
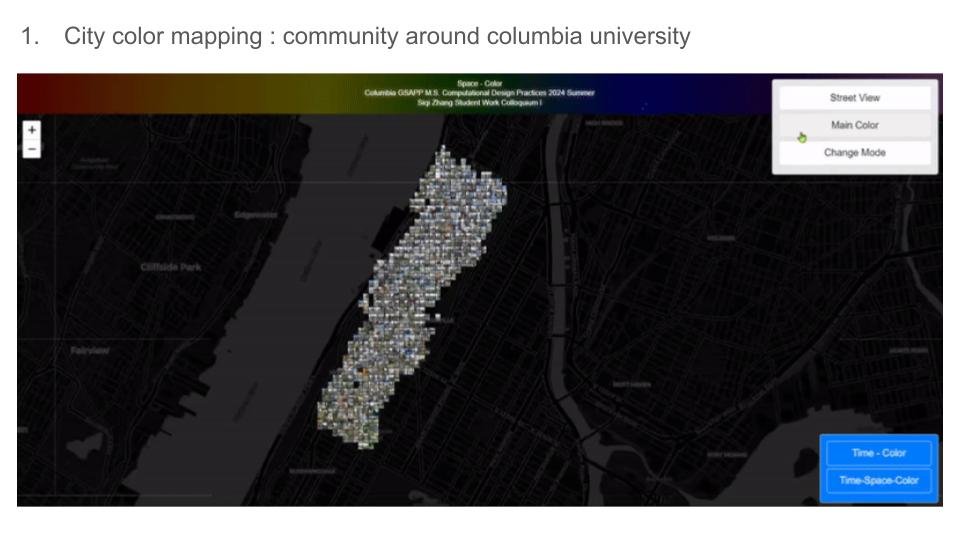
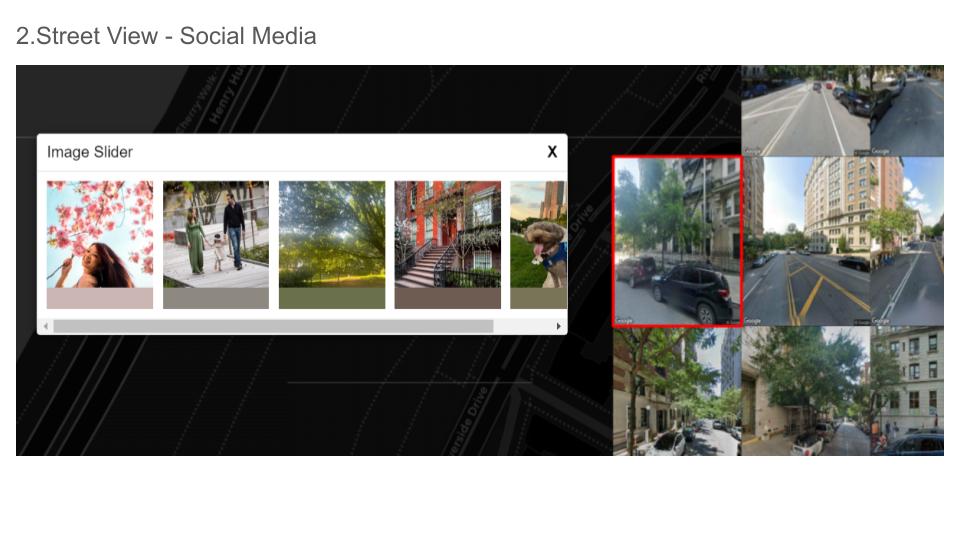
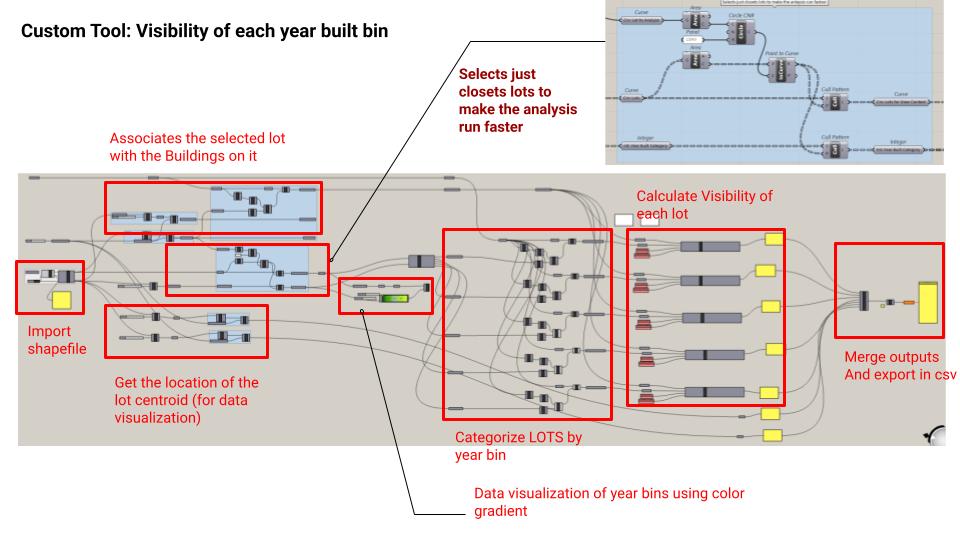
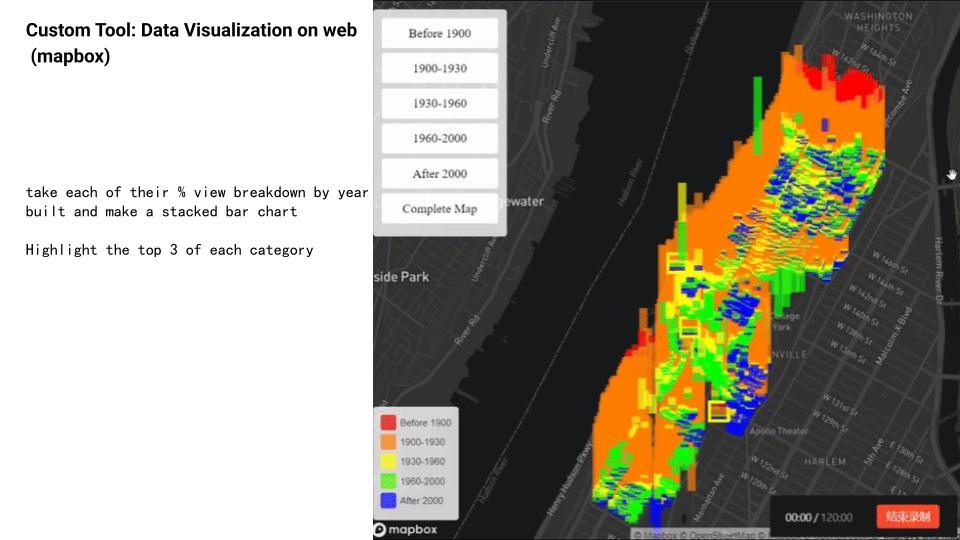
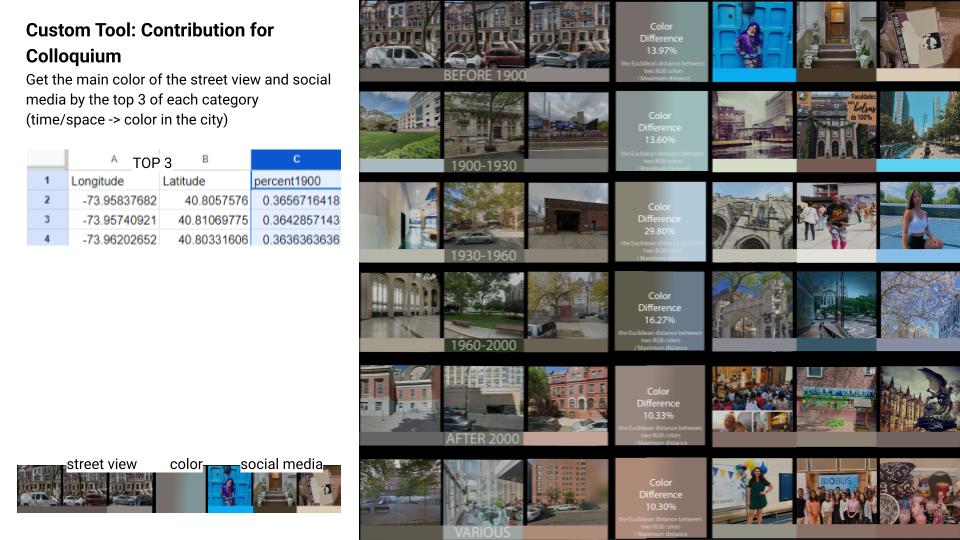
Under the hood, the workflow combines Python and Grasshopper for data prep, computer vision for CIELAB color extraction, and web technologies for visualization. PLUTO lot shapefiles supply build‐year attributes and geometry; a custom Grasshopper script computes spatial visibility; and a JavaScript front end (Mapbox + D3.js) renders time–space color maps, stacked bar charts, and image‐slider modals linking street views to Instagram samples. This end‑to‑end toolset enables a hands‑on, participatory exploration of urban color dynamics.